Project Background
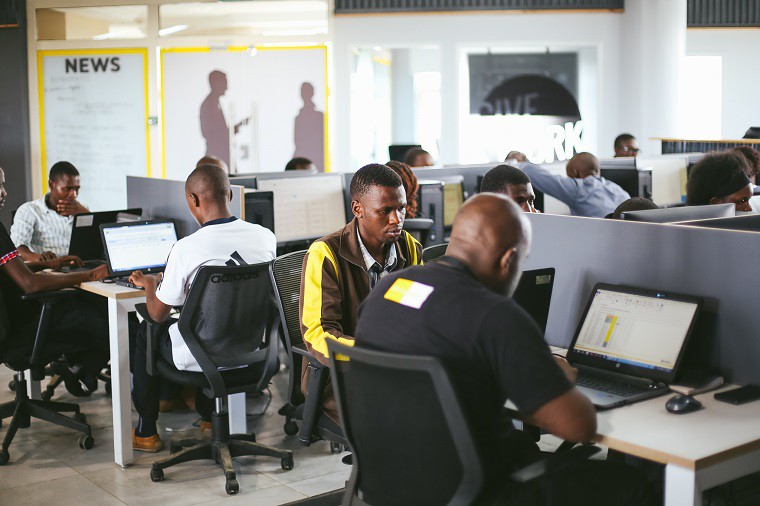
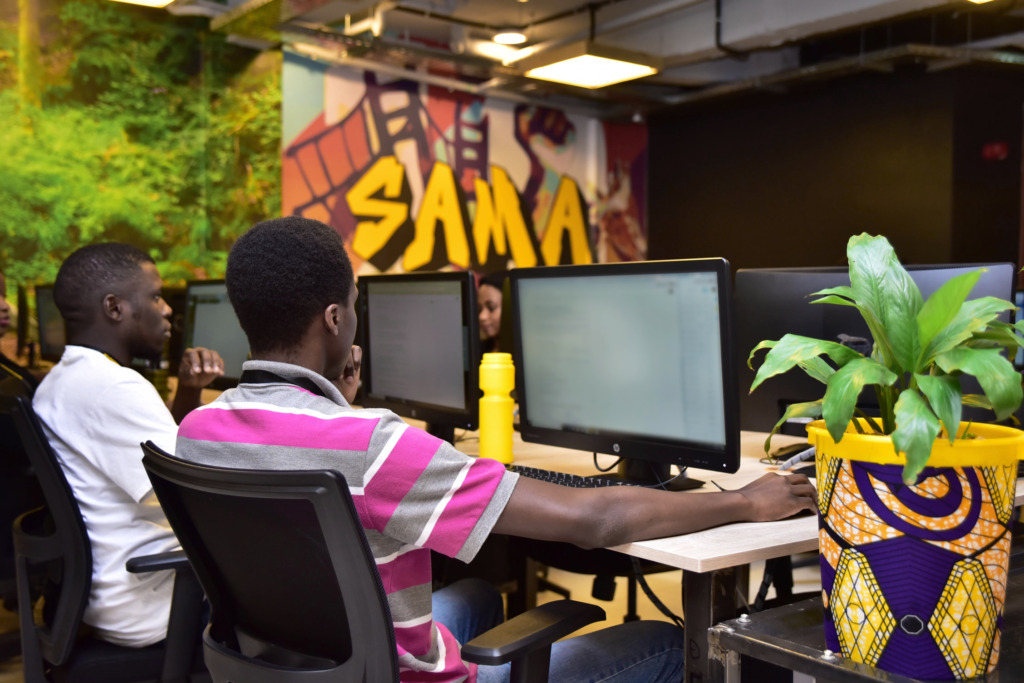
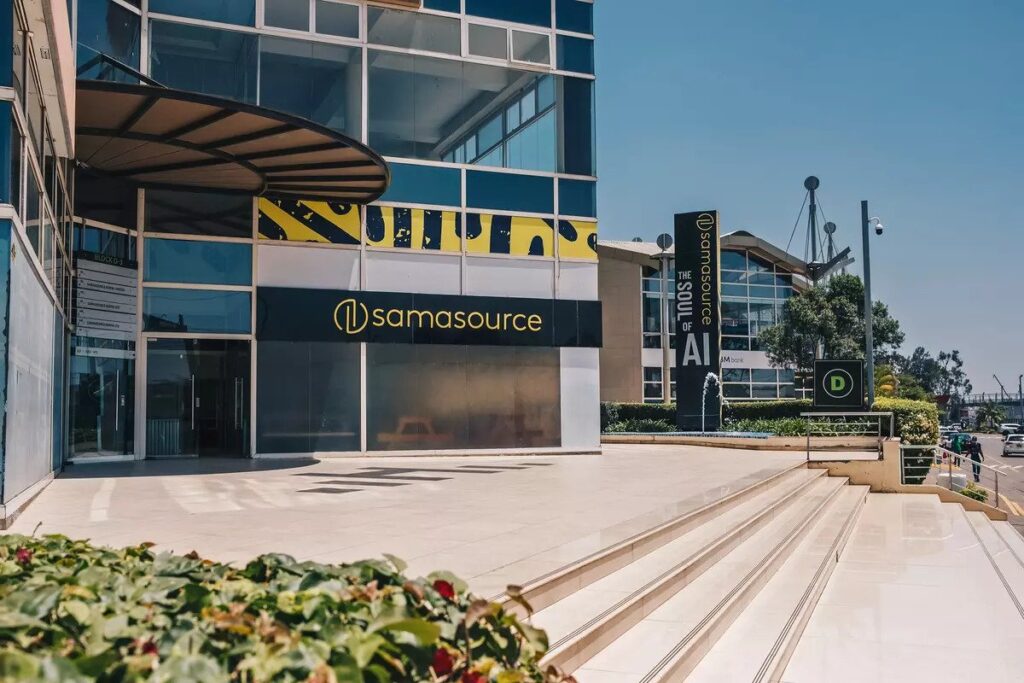
Sama has a workforce of over 2500 employees in East Africa, predominantly consisting of low-income individuals who earn less than $2 per day. By working as data annotators on the platform, Sama provides their employees with living wages, education, and other employment opportunities.
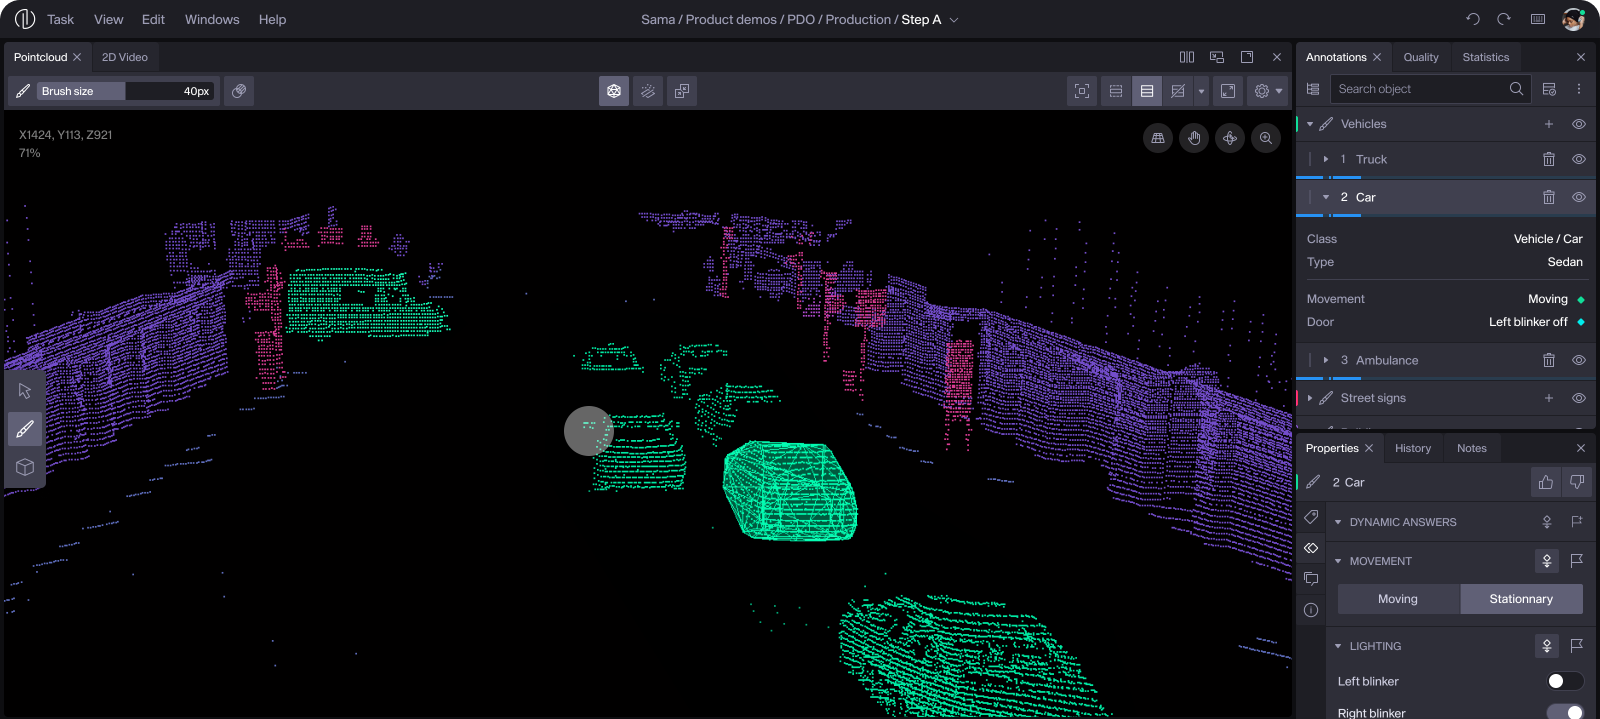
“The hub” is a complex annotation interface with an advanced set of tools used to label multiple types of data. Depending on the client’s needs and business opportunities, Sama had to adapt constantly to trends in the machine learning space by being pioneers in the labeling of data. More specifically in the computer vision industries (e.g. self-driving cars and AR/VR technologies).
Sensor Fusion and Semantic Segmentation
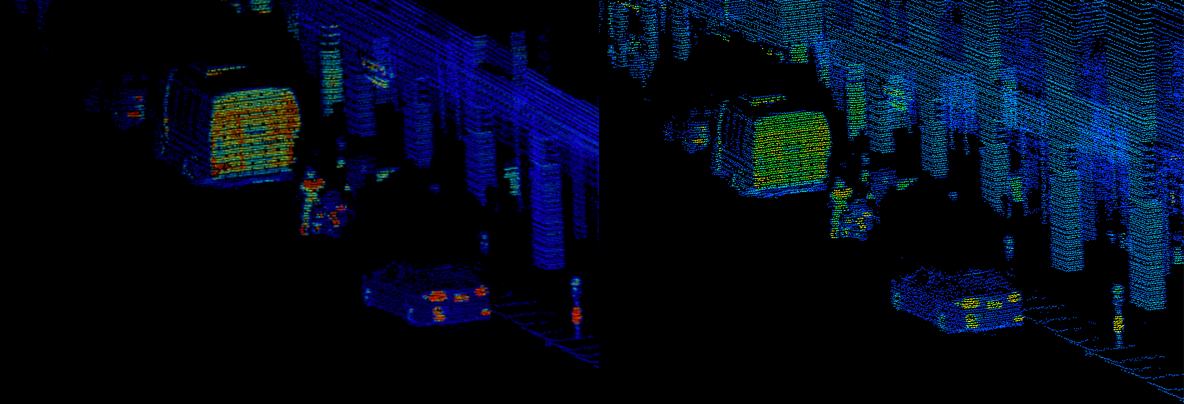
One of the many ways to train machine learning models for self-driving cars is by using LiDAR data. LiDAR is a technology which transmits laser light to create a 360 degrees 3D map (or point cloud) of the surroundings of a vehicle. Combined with other sources like video, allows a model to better identify and understand the distances of objects in relation to each other. This process is referred to in the industry as “Sensor Fusion”.
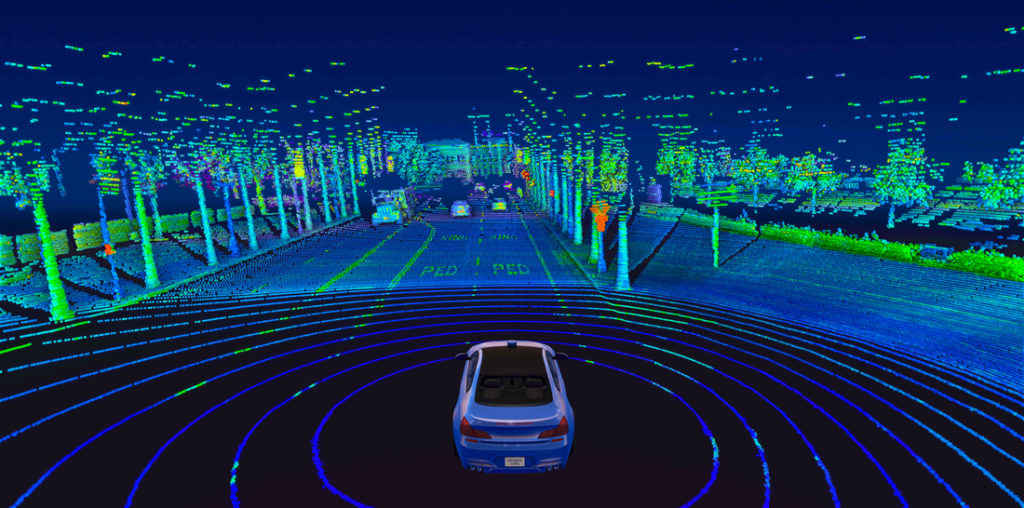
To label such data, an annotator needs an interface which can display all of these sources synchronously. The way it was done for most of these annotation interfaces was to drop cuboids in the point cloud scene, resizing, and moving them in a XYZ axis. This technique is quite time consuming and requires extreme precision in order to include as many points as tightly as possible around the object.
Edge cases such as objects colliding, or static elements such as trees and buildings (which are difficult to put inside of boxes), was making it difficult to achieve the high levels of accuracy required to avoid biases from mislabeled data.
Race to Find Cost Effective Technologies
This constant search for perfection in machine learning lead to a new promising technique: 3D Point Cloud Semantic Segmentation. In this workflow, instead of positioning cuboids around points, each point of light is assigned to an object layer. This way, every bits of data would be assigned to an object, and no confusion would be made by the model as to which point of light belongs to which object inside of the cuboid.
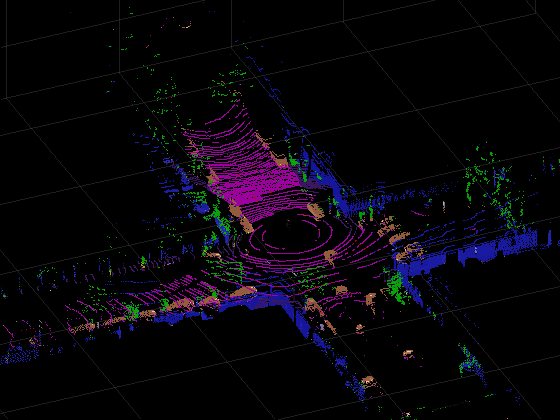
One question we asked ourselves was: How could we make this workflow cost effective? Given that the data often arrives in the form of videos, annotators would have to painstakingly paint each individual point of light in every frame. Depending on the client data, each annotation task could involve a different number of frames, typically ranging from 5 to 60.
With no clue on how other competitors were approaching the same problem, we embarked on a two-month innovation sprint to design and develop a proof of concept for a potential client.
The Workspace
Because not every client required their workflow to be fully semantic, I first had to adapt our interface to include both types of segmentation.
This particular workflow is known as “Panoptic Segmentation“, which combines the annotation of object instances with semantic layers. As an example, clients may request the annotation of moving objects such as cars and pedestrians using cuboids, while assigning buildings and trees to a broader object category using layers.
However, it is also possible to have instances of semantic layers nested within a category. For example, there could be an instance of a street sign labeled as “stop sign” within the broader category of signs.
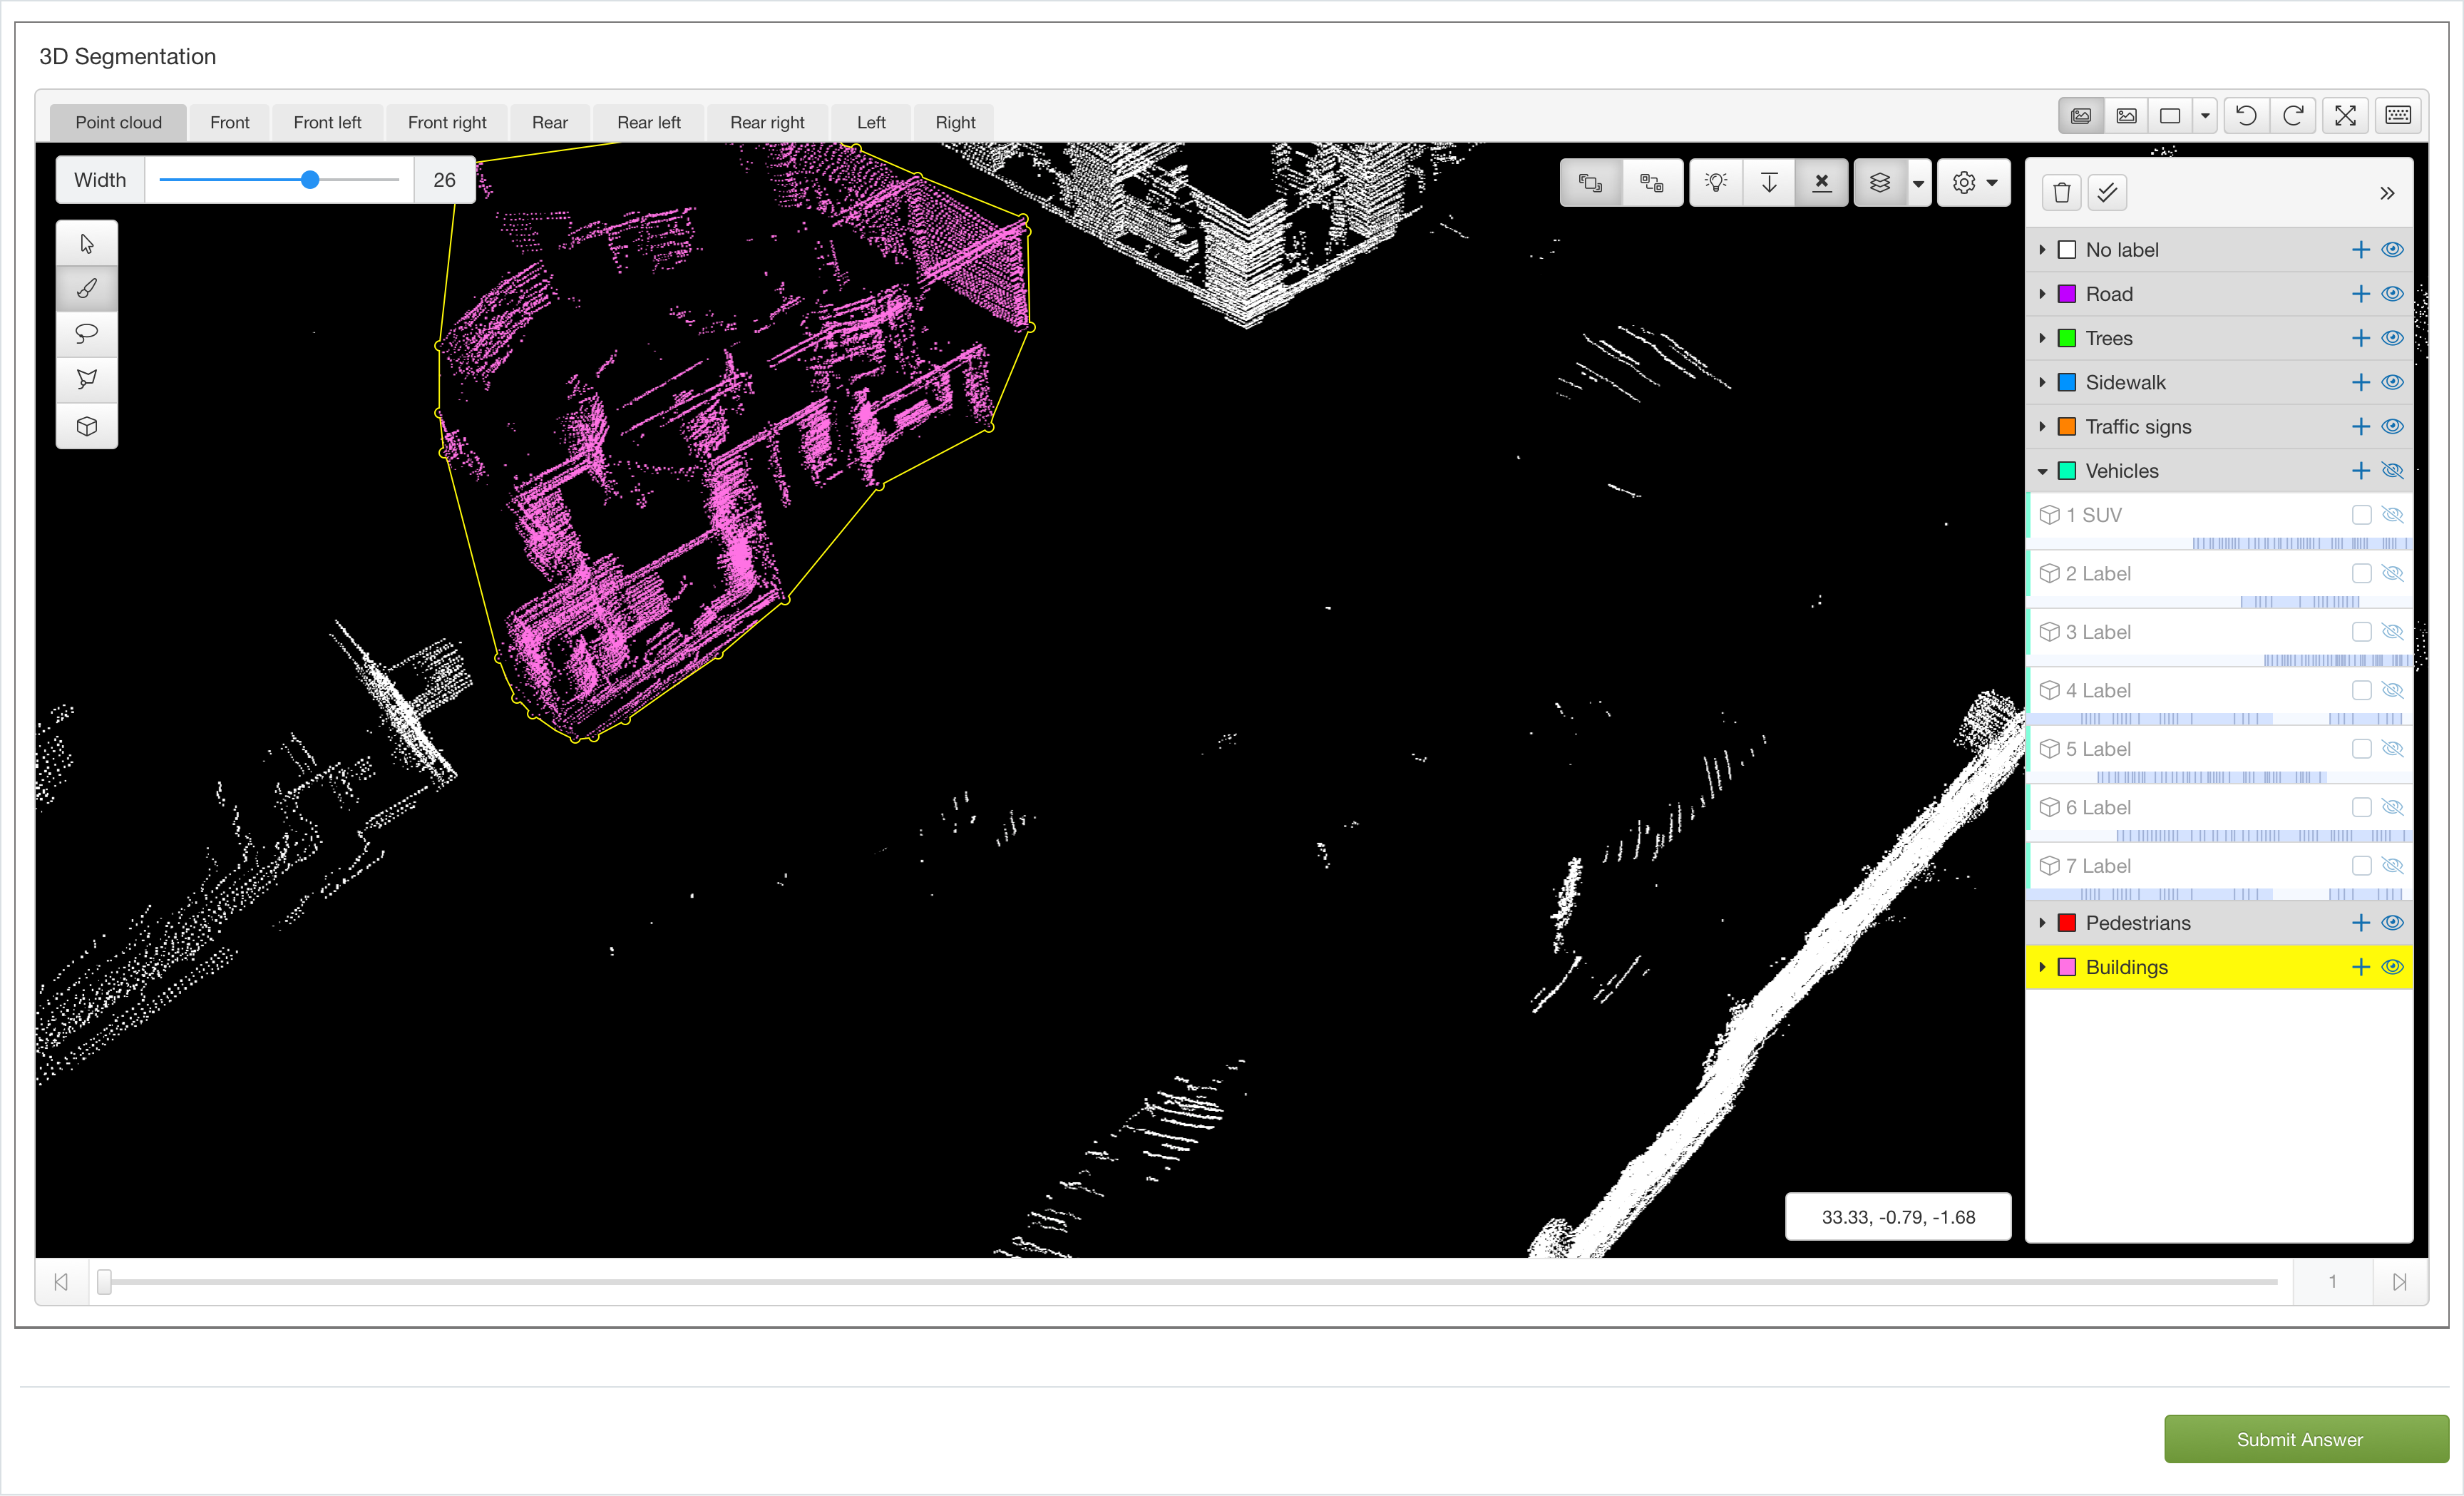
With semantic segmentation, every point of light must be labeled, so it was important to design features that would minimize the risks of missing points or mislabeling.
To address that, users could:
- Increase the size of points for better visibility.
- Overwrite mode. When disabled, only unlabeled points can be painted.
- Hide annotated points. This would help tell the user which points are left to be painted.
- Hide ground points. To avoid accidentally labeling the ground with objects above.
- Change the colourization of light points (”intensity source”) to height, distance or luminosity.
- Change the colour mapping. This would help colourblind users to see contrasts better.
The Tools
I came up with a series of tools to be developed for user testing. To meet the required levels of quality and quantity, I aimed to design these tools so that the results of user testing would demonstrate improvements in speed and accuracy.
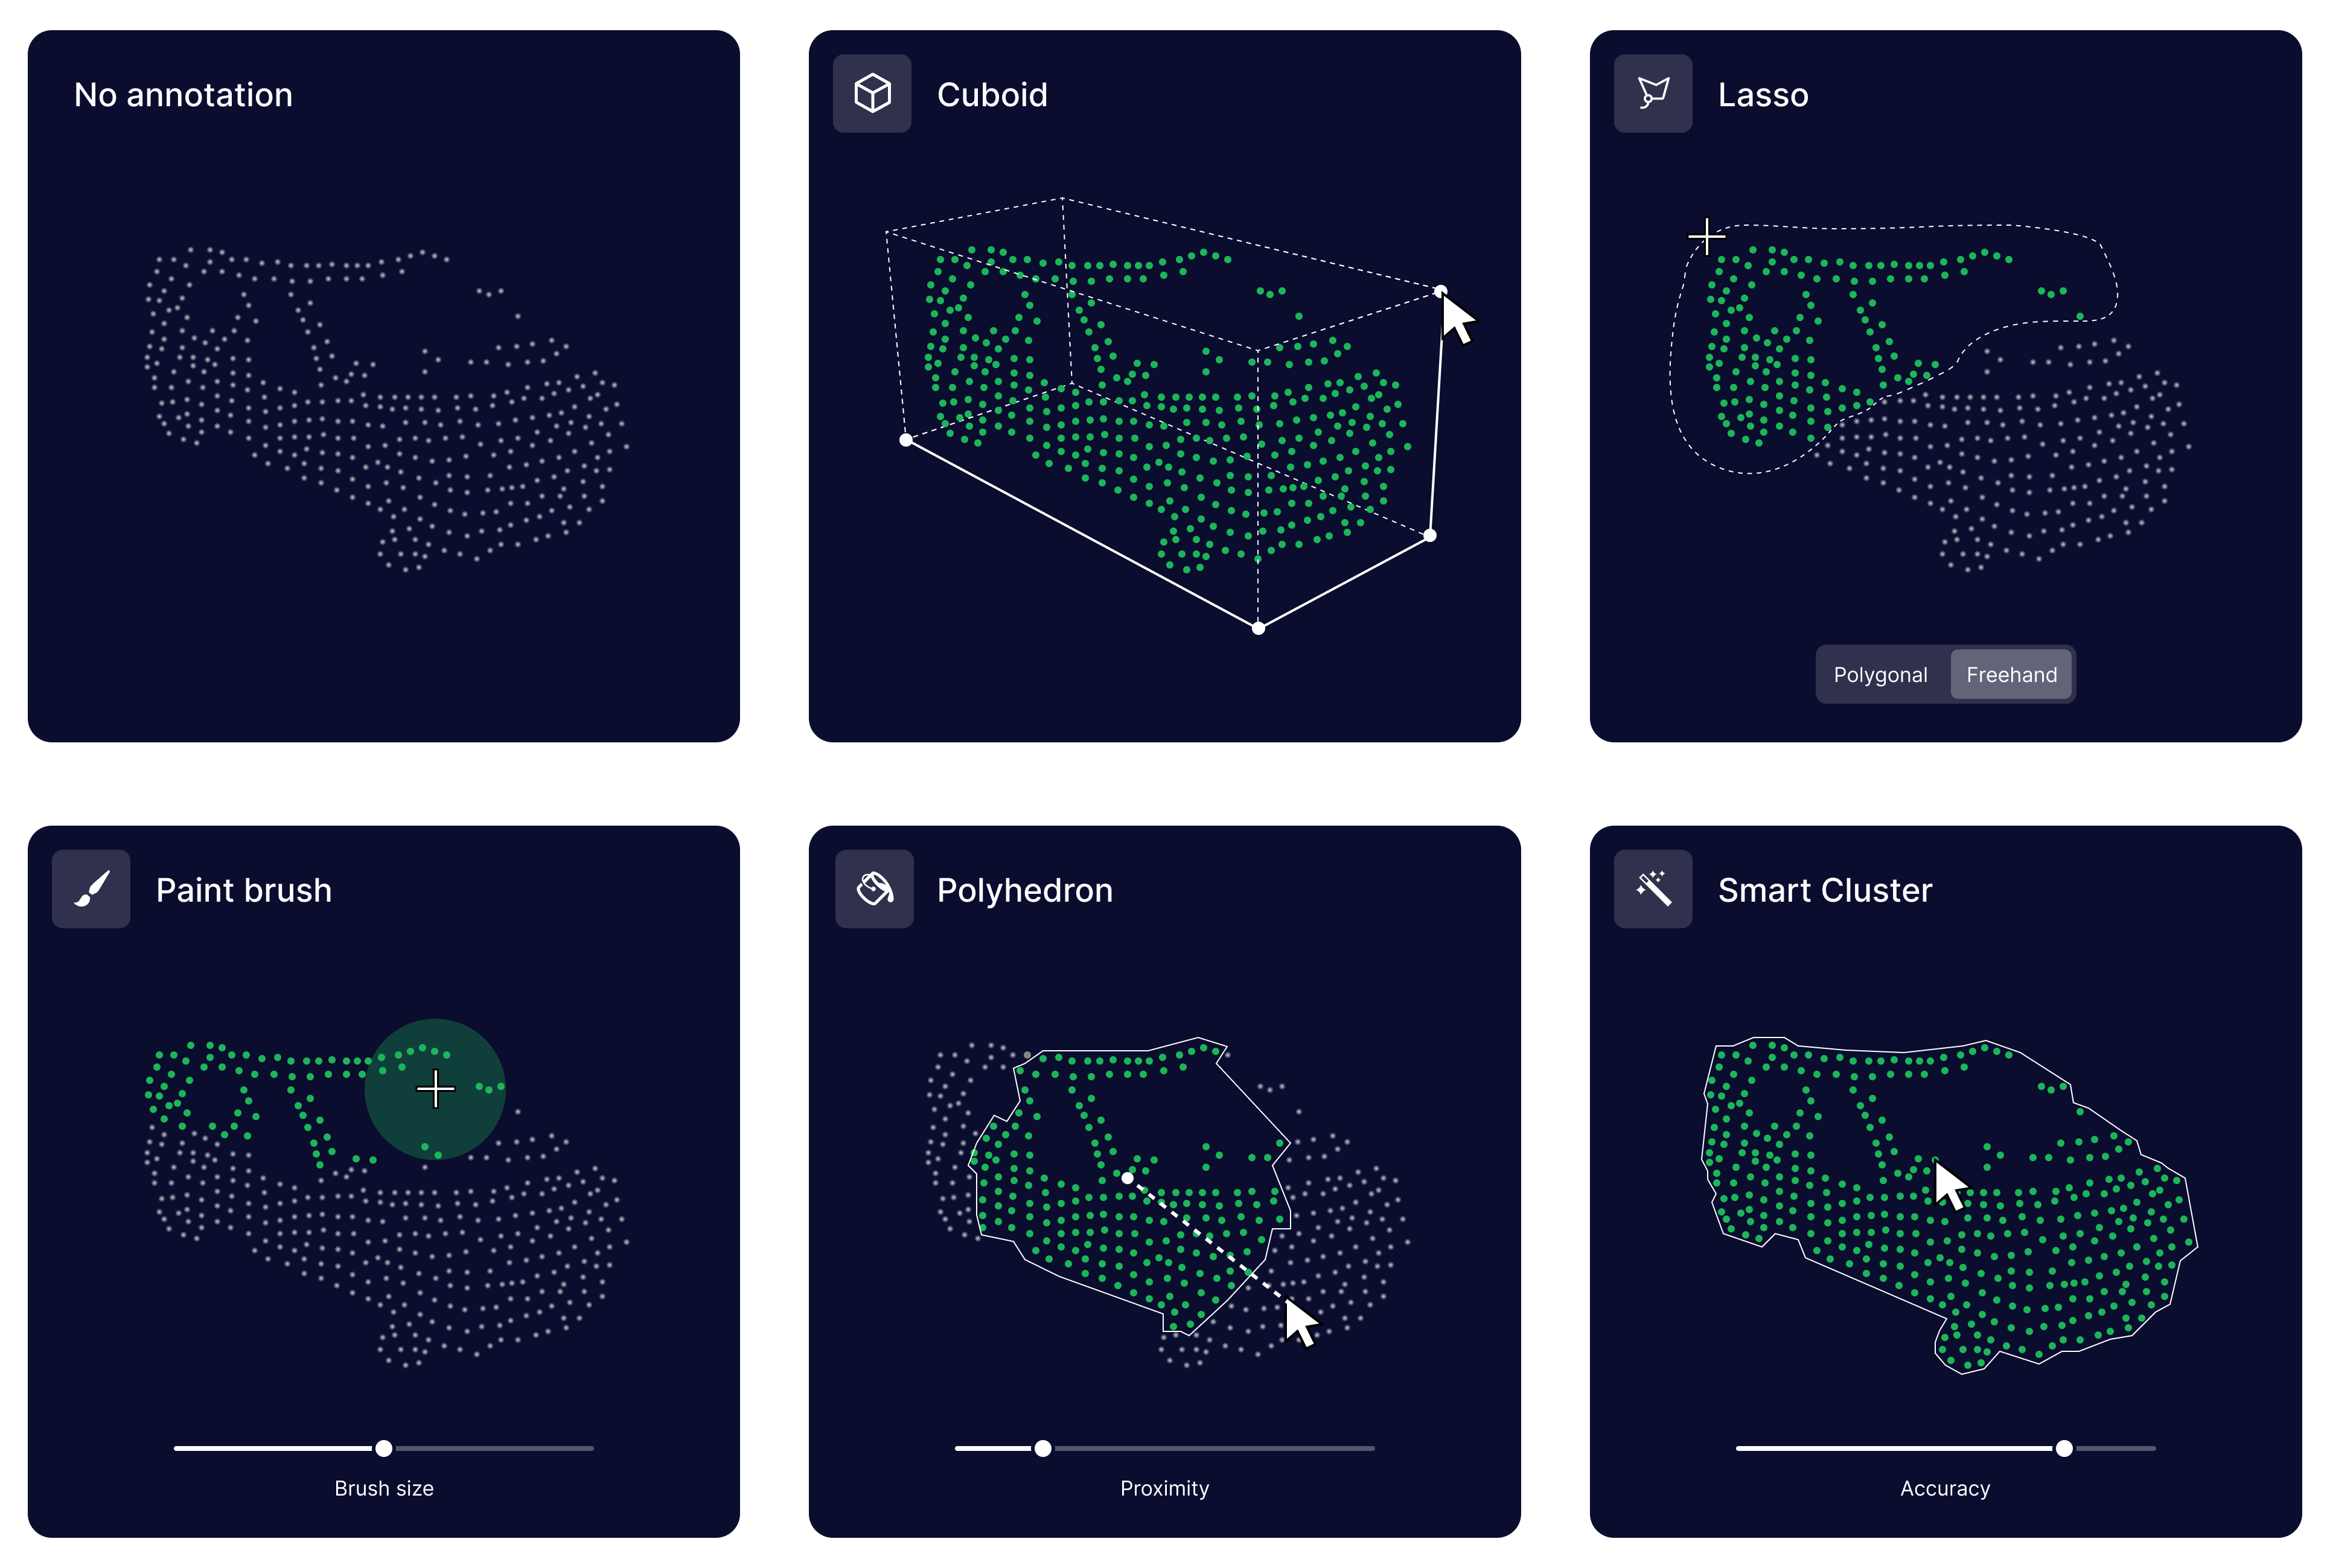
- Paintbrush: The user paints each light points with a resizable circular brush.
- Lasso: The user draws a selection around points with a freehand/polygonal lasso tool. (Note: This idea did not get implemented due to time constraints.)
- Cuboid: The user draws a cuboid with 4 clicks on the X, Y and Z axis. Using an algorithm, the cuboid encloses the nearest points from the user’s cursor before each click.
- Polyhedron: The user drags the mouse to expand a net which selects the closest neighbouring point. The result would create a polyhedron selection, which helped showing how the selection looked in the 3D space.
- Smart (AI) cluster: The user click on 1 point, and a pre-trained model would try to identify and paint which other points belong to the same object.
The User Testing
A team of 8 annotators spent 1 week using the tools for a client test run. As they were all based in Nairobi, I instructed the team to record their screens and provide highlights of their work with audio commentary. (We also had quantitative data to measure efficiency metrics.)
- Paintbrush tool: Best for accuracy and speed, but depending on the camera angle, it would paint points far in the background.
- Cuboid fill tool: The slowest tool. The algorithm would fail to add secluded points, necessitating frequent manual adjustments.
- Polyhedron tool: Fast for isolated objects such as cars on the road, but inefficient when objects collide.
- Smart (AI) cluster tool: Would not work if objects had minimal data, particularly objects with very few light points, which was the case with most of the objects in the scene.
From these learnings, we ended up merging the polyhedron tool with the brush tool. This feature proved helpful for quickly identifyinganymistaken points painted in the background. As users could easily detect such errors by observing the stretching of the polyhedron when adjusting the camera position.
Users Found Ways to Gain Efficiency
Near the end of the week of research, our annotators found workarounds to speed up their process with creative techniques that we did not expect. This gave us the blueprints for what an optimal workflow would look like in production:
- Annotate all moving objects in the scene with cuboids, moving the cuboids in every frame.
- Hide all annotated/moving objects, turning the scene into an empty “ghost town”.
- Merge all frames together. Because static objects don’t move through time, this would make them appear even more clearly, as every frame would add light points of data.
- Paint static objects with the brush. Because the frames are merged, it would paint all frames at the same time.
The Results
After these 2 months, we had a successful, functional proof of concept that we sold to three clients in the automotive industry. More specifically:
- The brush/polyhedron tool improved annotation time by 30% and reduced errors by 40%.
- The new 3D view settings and features reduced the time to review 3D annotation tasks by half.
- The panoptic workflow we defined ended up reducing the cost of this type of workflow to our targeted competitive price.
- With these new clients, Sama created more than 300 new jobs in Nairobi.
The Vision
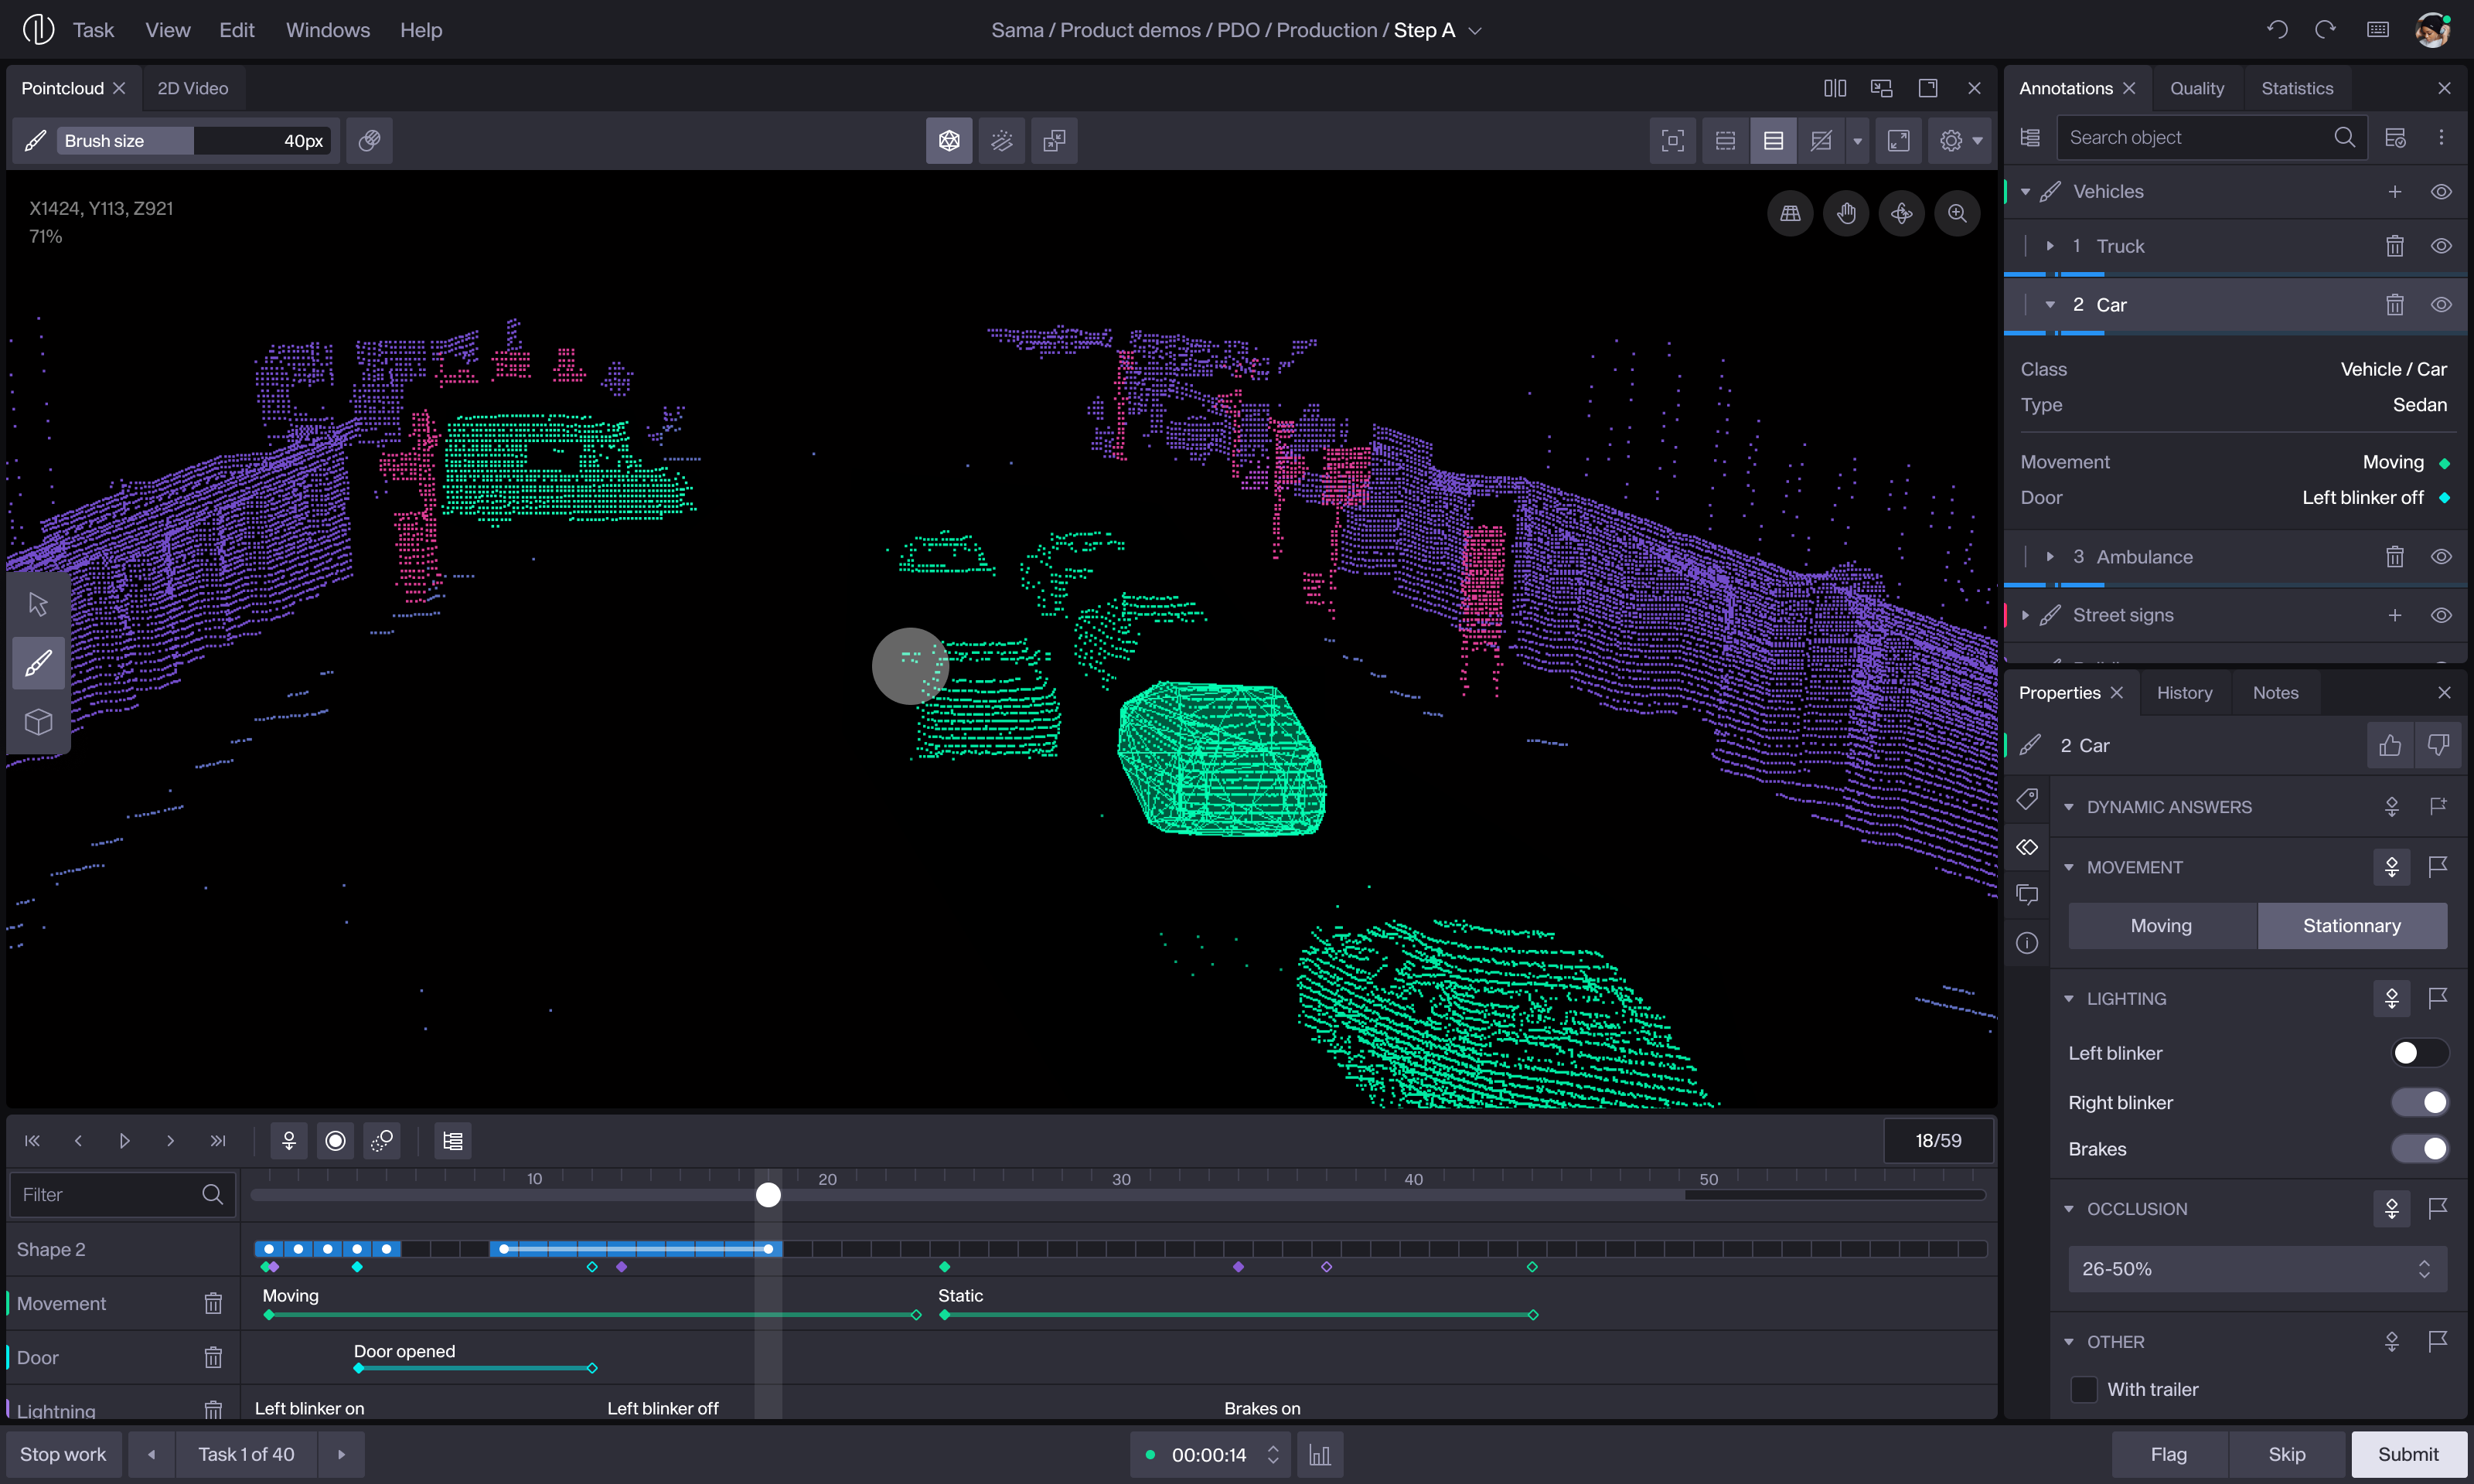
With an optimal workflow and tools defined, I designed a north star interface using a new design system we were developing. We then used those screens to show clients and investors our product vision for 2022.
Thank You for Reading
If you would like to know more about my design process for this project, schedule a call with me! There is still so much more to share about this project, and I would be delighted to discuss it further.
